Guide to Staking on Ethereum 2.0 (Ubuntu/Medalla/Prysm)

***
NOTE: This guide is now deprecated. Please use the newer version targeting the Goerli testnet.
*** located here.
This is a step-by-step guide to staking on Ethereum 2.0 via the Medalla multi-client testnet. It is based on the following technologies:
- Ubuntu v20.04 (LTS) x64 server
- Go Ethereum Node (code branch)
- Prysmatic Labs Ethereum 2.0 client — Prysm (code branch)
- Official multi-client testnet public network, Medalla
- MetaMask crypto wallet browser extension
- Prometheus metrics
- Grafana dashboard
This guide includes instructions on how to:
- Configure a newly running Ubuntu server instance.
- Configure and run an Ethereum 1.0 node as a service.
- Compile and configure the Prysmatic Labs beacon chain and validator client software for Ethereum 2.0, Phase 0 (Medalla testnet) and run them as a service.
- Install and configure Prometheus metrics and set up a Grafana dashboard to view and alert.
WARNING
This guide is for the Medalla testnet. DO NOT, under any circumstances, send real ETH to this testnet. You will lose it.
Acknowledgements and Disclaimer
This guide is based on information I pulled together from various on-line resources and this guide wouldn’t exist without them. Thank you, all!
And a special Thank You to the client team and the EF researchers. Your tireless efforts over the past few years have brought us to the cusp of an incredible moment in history — the launch of Ethereum 2.0.
This is for educational purposes only. I’m not an expert in any of the technologies listed in this guide. I got it working and it’s a lot of fun, so I wanted to share it with others. Please forgive any errors or ill-informed choices. The accuracy of this guide is not guaranteed. Feedback is always welcome!
Prerequisites
This guide is not intended for absolute beginners. It assumes some knowledge of Ethereum, ETH, staking, Linux, and MetaMask. Before you get started you will need to have your Ubuntu server instance up and running. It will help to have the MetaMask browser extension installed and configured somewhere. The rest we will do along the way.
Note for Raspberry Pi Users
I haven’t tested this guide on a Rpi. If you want to try, just swap out the software listed below for the ARM version, where available. No guarantee it will work!
Requirements
- Ubuntu server instance. I used v20.04 (LTS) amd64 server VM.
- MetaMask crypto wallet browser extension, installed and configured.
- Hardware minimum requirements to run Prysm software:
— Operating System: 64-bit Linux
— Processor: Intel Core i5–760 or AMD FX-8100 or better
— Memory: 4GB RAM (8GB recommended)
— Storage: 20GB available space SSD
— Internet: Stable broadband connection
Overview
This is a long and detailed guide. Here’s a super-simplified diagram to help you conceptualize what we are going to do. The yellow boxes are the parts this guide mostly covers.

The conceptual flow is:
- Set up a Eth1 node and sync it with the Eth1 Göerli testnet
- Configure Beacon Node and sync it with the Eth1 Node
- Generate and activate validator keys
- Configure the Validator Client
- The Beacon Node makes the magic happen (blocks, attestations, slashings) with the help of the validator (signing).
Let’s get started!
***
NOTE: This guide is now deprecated. Please use the newer version targeting the Pyrmont testnet.
*** located here.
Step 0 — Connect to the Server
Using a SSH client, connect to your Ubuntu server. The root user account on Ubuntu server is normally disabled by default, however some cloud providers enable it. If you are logged in as root then let’s create a user-level account with admin privileges instead, because using the root user to log in is risky.
NOTE: If you are not logged in as root then skip this and go to Step 1.
# adduser <yourusername>You will asked to create a password and some other information.
Grant admin rights to the new user by adding it to the sudo group.
# usermod -aG sudo <yourusername>When you log in as <yourusername> you can type sudo before commands to perform actions with superuser privileges.
Optional: If you used SSH keys to connect to your Ubuntu instance via the root user you will need to associate the new user with the root user’s SSH key data.
# rsync --archive --chown=<yourusername>:<yourusername> ~/.ssh /home/<yourusername>Finally, log out of root and log in as <yourusername>.
Step 1 — Update Your System
Make sure your system is up to date with the latest software and security updates.
$ sudo apt update && sudo apt upgrade
$ sudo apt dist-upgrade && sudo apt autoremove
Step 2— Secure Your System
Security is important. This is not a comprehensive security guide, just some basic settings: a firewall and a user account.
Configure the firewall
Ubuntu 20.04 servers can use the default UFW firewall to restrict inbound traffic to the server. Before we enable it we need to allow inbound traffic for SSH, Go Ethereum, Grafana, and Prysm.
Allow SSH
Allows connection to the server over SSH. For security reasons we are going to modify the default port of 22 because it is a common attack vector.
Note: If you would rather not change the default SSH port (not recommended), then include a rule allowing the default SSH port
$ sudo ufw allow 22/tcpand move onto the “Allow Go Ethereum” section.
Choose a port number between 1024–49151 and run the following command to make sure your selection is not already in use on the server. If it is (red text), choose a different port.
$ sudo ss -tulpn | grep ':<yourSSHportnumber>'Update the firewall to allow inbound traffic on <yourSSHportnumber>. SSH requires TCP.
$ sudo ufw allow <yourSSHportnumber>/tcpNext change the default SSH port.
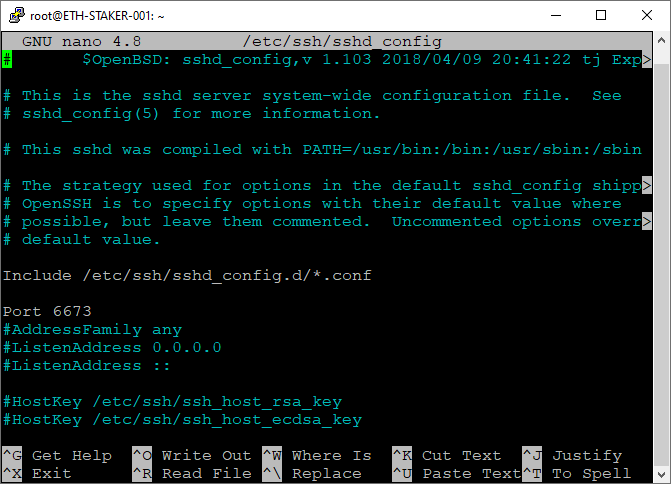
$ sudo nano /etc/ssh/sshd_configFind the line with # Port 22 or Port 22 and change it to Port <yourSSHportnumber>. Remove the # if it was present.
Check the screen shot below for reference. Your file should look similar to that (but with the port number you chose). Exit and save.
Restart the SSH service.
$ sudo systemctl restart sshNext time you log in via SSH use <yourSSHportnumber> for the port.
Optional: If you were already using UFW with port 22/TCP allowed then update the firewall to deny inbound traffic on that port. Only do this after you log in using the new SSH port.
$ sudo ufw deny 22/tcpAllow Go Ethereum
Allows incoming requests from Go Ethereum peers (port 30303/TPC and 30303/UDP). If you’d rather use a node hosted by a 3rd party (Infura, etc.) then skip this step.
Note: If you are hosting your Ubuntu instance locally your internet router may need to be configured to allow incoming traffic on these ports as well.
$ sudo ufw allow 30303Allow Prysm
Allows P2P connections with peers for actions on the beacon node. Ports 13000/TCP and 12000/UDP are listed as defaults by Prysmatic Labs.
Note: If you are hosting your Ubuntu instance locally your internet router and/or firewall will need to be configured to allow incoming traffic on these ports as well.
$ sudo ufw allow 13000/tcp
$ sudo ufw allow 12000/udp
Allow Grafana
Allows incoming requests to the Grafana web server (port 3000/TCP).
$ sudo ufw allow 3000/tcpAllow Prometheus (Optional)
If you want direct access to the Prometheus data service you can open up port 9090/TCP as well. This is not necessary if you are solely using Grafana to view the data. I did not open this port.
$ sudo ufw allow 9090/tcpNow enable the firewall and check to verify the rules have been correctly configured.
$ sudo ufw enable
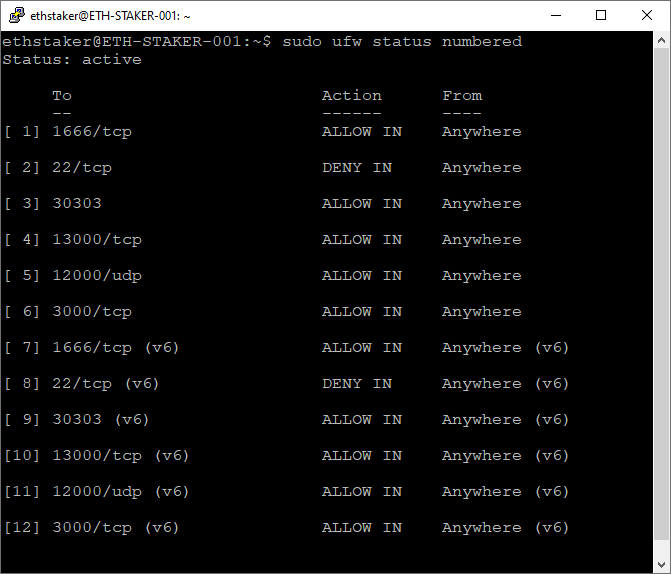
$ sudo ufw status numbered
Output should look something like this. 1666/tcp is the SSH port number I used.
Step 3 — Configure ntpd Timekeeping (Optional)
Ubuntu has time synchronization built in and activated by default using systemd’s timesyncd service. However, for applications that require more precise timekeeping (like a blockchain) we will use ntpd.
First, we must disable timesyncd and verify it is off. Output should show NTP service: inactive.
$ sudo timedatectl set-ntp no
$ timedatectl
Next, install the ntp package. It will be started automatically after install. Verify the package.
$ sudo apt install ntp
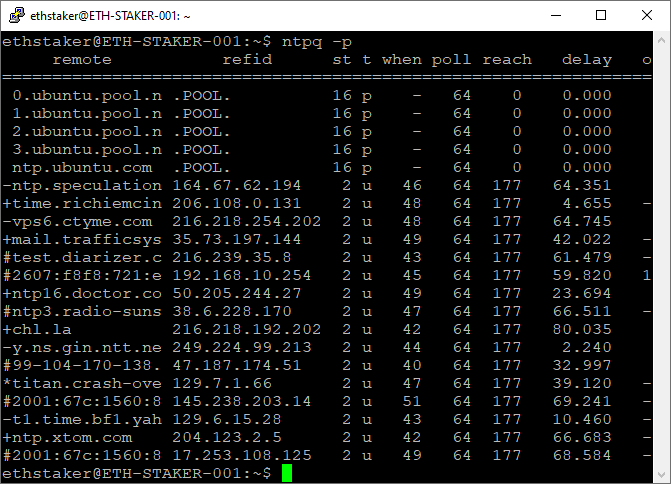
$ ntpq -p
Output should look like this:
We can further verify the service is running as expected.
$ ntpq -c rvResults in:
ethstaker@ETH-STAKER-001:~$ ntpq -c rv
associd=0 status=0615 leap_none, sync_ntp, 1 event, clock_sync,
version="ntpd 4.2.8p12@1.3728-o (1)", processor="x86_64",
system="Linux/5.4.0-48-generic", leap=00, stratum=2, precision=-24,
rootdelay=1.453, rootdisp=8.653, refid=209.51.161.238,
reftime=e315548b.d020811b  Wed, Sep 23 2020  4:58:51.812,
clock=e31554cf.99ddcf68  Wed, Sep 23 2020  4:59:59.601, peer=5978, tc=6,
mintc=3, offset=3.040122, frequency=6.453, sys_jitter=2.164815,
clk_jitter=2.062, clk_wander=0.539, tai=37, leapsec=201701010000,
expire=202012280000
In the output (2nd line) we have leap_none. This is the Leap Field and the value (leap_none) is a code that indicates we have a normal synchronized state.
In the output (2nd line) we have sync_ntp. This is the Source Field and the value (sync_ntp) is a code that indicates we are using NTP.
In the output (2nd line) we have clock_sync. This is the Event Field and the value (clock_sync) is a code that indicates the clock is synchronized. Output may initially show freq_mode instead of clock_sync. Give it some time to initialize.
If you have different codes to these check here to see a list of possible values. Resolve any issues as necessary.
***
NOTE: This guide is now deprecated. Please use the newer version targeting the Pyrmont testnet.
*** located here.
Step 4— Install and Run Go Ethereum Node
Install and configure an Ethereum 1.0 node that your beacon-chain will connect to. If you’d rather use a node hosted by a 3rd party (Infura, etc.) then skip this step.
Install Go Ethereum
Go Ethereum recommends using PPA’s (Personal Package Archives).
$ sudo add-apt-repository -y ppa:ethereum/ethereumUpdate the packages and install the latest stable version.
$ sudo apt update
$ sudo apt install geth
Run Go Ethereum as a Background Service
Create an account for the service to run under. This type of account can’t log into the server.
$ sudo useradd --no-create-home --shell /bin/false goethCreate the data directory for the Eth1 chain. This is required for storing the Eth1 node data. Use the -p option to create the full path.
$ sudo mkdir -p /var/lib/goethereumSet directory permissions. The goeth account needs permission to modify the data directory.
$ sudo chown -R goeth:goeth /var/lib/goethereumCreate a systemd service file to store the service config. We will use the config file to tell systemd to run the geth process.
$ sudo nano /etc/systemd/system/geth.servicePaste the following service configuration into the file.
[Unit]
Description=Ethereum go client
After=network.target
Wants=network.target[Service]
User=goeth
Group=goeth
Type=simple
Restart=always
RestartSec=5
ExecStart=geth --goerli --http --datadir /var/lib/goethereum

[Install]
WantedBy=default.target
The --goerli flag is used to target the Göerli test network and the --http flag is to expose an endpoint (http://localhost:8545) that the beacon chain will connect to.
Check the screen shot below for reference. Your file should look like that. Exit and save.

Reload systemd to reflect the changes.
$ sudo systemctl daemon-reloadStart the service and check to make sure it’s running correctly.
$ sudo systemctl start geth
$ sudo systemctl status geth
Output should look like this.

If you did everything right, it should say active (running) in green text. If not then go back and repeat the steps to fix the problem. Press Q to quit.
Enable the geth service to automatically start on reboot.
$ sudo systemctl enable gethThe Go Ethereum node will begin to sync. You can follow the progress by running the journal command. Press Ctrl+C to quit.
$ sudo journalctl -f -u geth.serviceIt may take a while to find peers to sync. If so you can add some peers to help things along. Go here for the latest list and modify the geth service as follows:
$ sudo systemctl stop geth
$ sudo nano /etc/systemd/system/geth.service
Modify the ExecStart line and add the --bootnodes flag with a few of the latest peers (comma separated).
ExecStart=geth --goerli --http --datadir /var/lib/goethereum --bootnodes "enode://46add44b9f13965f7b9875ac6b85f016f341012d84f975377573800a863526f4da19ae2c620ec73d11591fa9510e992ecc03ad0751f53cc02f7c7ed6d55c7291@94.237.54.114:30313,enode://119f66b04772e8d2e9d352b81a15aa49d565590bfc9a80fe732706919f8ccd00a471cf8433e398c55c4862aadb4aadf3a010201483b87e8358951698aa0b6f07@13.250.50.139:30303"Save the file and exit. Restart the service and observe.
$ sudo systemctl daemon-reload
$ sudo systemctl start geth
$ sudo journalctl -f -u geth.service
Once it gets started the output should look like this.
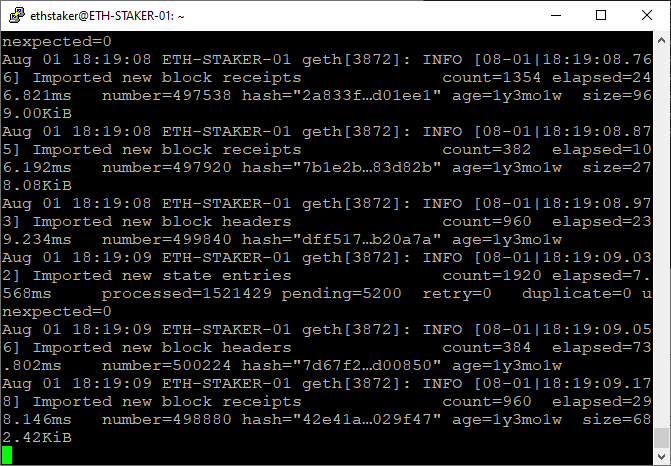
You should wait for the node sync to complete before you run the beacon chain. You can see the latest block here.
For example, the screen shot above shows the node is processing block number=498880 and looking at the screen shot below, we can see the latest block number is 3270051. So based on that we still have a while to go before completing the sync.

Next we will clone and build the Prysm software (beacon-node and validator). Consider opening a new terminal window here so you can continue to observe the Eth1 node sync.
Step 5— Install Bazel
Bazel is an open-source build tool. We will use it to compile the Prysm software.
Curl is required so we can download the Prysm code.
$ sudo apt install curl gnupgDownload and add the Bazel gpg distribution URI as a package source.
$ curl -fsSL https://bazel.build/bazel-release.pub.gpg | gpg --dearmor > bazel.gpg
$ sudo mv bazel.gpg /etc/apt/trusted.gpg.d/
$ echo "deb [arch=amd64] https://storage.googleapis.com/bazel-apt stable jdk1.8" | sudo tee /etc/apt/sources.list.d/bazel.list
According to Bazel’s documentation, the component name “jdk1.8” is kept for legacy reasons only and doesn’t relate to supported or included JDK versions anymore.
Install Bazel. First install the latest version, then install 3.2.0. Prysm currently requires version 3.2.0.
$ sudo apt update && sudo apt install bazel
$ sudo apt update && sudo apt full-upgrade
$ sudo apt update && sudo apt install bazel-3.2.0
Install some prerequisites to allow us to compile with the --config=release flag.
$ sudo apt install -y libtinfo5 # Terminal handling
$ sudo apt-get install -y libssl-dev # OpenSSL
$ sudo apt-get install -y libgmp-dev # GMP source to build BLS
***
NOTE: This guide is now deprecated. Please use the newer version targeting the Pyrmont testnet.
*** located here.
Step 6— Install and Build Prysm
The Prysm client is made up of two binaries: the beacon-chain and the validator. We will build both here.
We will use the tag v1.0.0-beta.2 as that is the last supported version for the Medalla testnet. The --single-branch flag prevents fetching all branches.
$ git clone -b v1.0.0-beta.2 --single-branch https://github.com/prysmaticlabs/prysm.git
$ cd prysm
Use Bazel Build to compile the beacon chain and validator binaries.
$ bazel build //beacon-chain:beacon-chain --config=release
$ bazel build //validator:validator --config=release
The Beacon chain takes a while to build. Good time to get a fresh beverage and re-hydrate. Maybe check out a few of my other articles.
Building the validator is faster as it is smaller in size and most of the dependencies have already been downloaded and/or built.
If both builds succeed then continue. If not get help on the Prysm Discord.
Step 7— Configure the Beacon Chain
We will run the beacon chain as a service so if the system restarts the process will automatically start back up again.
Setup Accounts and Directories
Create an account for the service to run under. This type of account can’t log into the server.
$ sudo useradd --no-create-home --shell /bin/false prysm-beaconchainCreate the data directory for the beacon chain. This is required for storing the beacon chain database.
$ sudo mkdir -p /var/lib/prysm/beaconchainSet directory permissions. The prysm-beaconchain account needs permission to modify the database directory.
$ sudo chown -R prysm-beaconchain:prysm-beaconchain /var/lib/prysm/beaconchainCopy the Beacon Chain Binary
Next, copy the newly compiled beacon-chain binary to the /usr/local/bin directory. We will run it from there.
$ cd ~
$ sudo cp prysm/bazel-bin/beacon-chain/beacon-chain_/beacon-chain /usr/local/bin
Create and Configure the Service
Create a systemd service file to store the service config.
$ sudo nano /etc/systemd/system/prysm-beaconchain.servicePaste the following into the file.
[Unit]
Description=Prysm Beaconchain
Wants=network-online.target
After=network-online.target[Service]
Type=simple
User=prysm-beaconchain
Group=prysm-beaconchain
Restart=always
RestartSec=5
Environment="ClientIP=$(curl -s v4.ident.me)"
ExecStart=/bin/bash -c '/usr/local/bin/beacon-chain --medalla --p2p-host-ip=${ClientIP} --datadir=/var/lib/prysm/beaconchain --http-web3provider=http://127.0.0.1:8545 --accept-terms-of-use'[Install]
WantedBy=multi-user.target
The --medalla flag is required to indicate we are running against the testnet.
The --p2p-host-ip flag is recommended to improve peer networking. We use an Environment variable Environment="ClientIP=$(curl -s v4.ident.me)" to get the client IP address because ExecStart doesn’t allow the call in-line. Using --p2p-host-ip=${ClientIP} is the work-around.
The --http-web3provider flag defines the endpoint of the Eth1 node. If you installed one locally the value is http://127.0.0.1:8545. If you’re using a third party use the external endpoint address.
The --accept-terms-of-use flag is required in order to be able to run the binary as a service. Using this flag indicates acceptance of the Prysm terms of use.
Check the screen shot below for reference. Your file should look like that. Exit and save.

Reload systemd to reflect the changes.
$ sudo systemctl daemon-reloadNOTE: If you are running a local Eth1 node (see Step 4) you should wait until it fully syncs before starting the beaconchain service. Check progress here:
sudo journalctl -f -u geth.service
Start the service and check to make sure it’s running correctly.
$ sudo systemctl start prysm-beaconchain
$ sudo systemctl status prysm-beaconchain
Output should look like this.

If you did everything right, it should say active (running) in green text. If not then go back and repeat the steps to fix the problem. Press Q to quit.
Enable the service to automatically start on reboot.
$ sudo systemctl enable prysm-beaconchainThe beacon-chain will begin to sync. It may take several hours for the node to fully sync. You can check the progress by running the journal command. Press Ctrl+C to quit.
$ sudo journalctl -f -u prysm-beaconchain.serviceThe terminal output gives status information that it is processing deposits from the Eth1 chain.
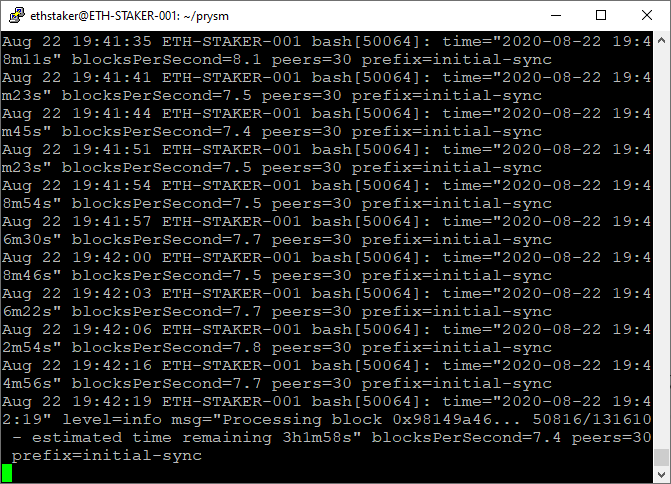
Now your beacon chain is running as a service. Congratulations!
***
NOTE: This guide is now deprecated. Please use the newer version targeting the Pyrmont testnet.
*** located here.
Step 8— Complete the Medalla On-boarding Process
In order to run a validator on the Eth2.0 Medalla testnet we will need to sign up for one or more validator accounts.
NOTE: If you have already generated your deposit data and submitted your staking deposits you can skip this step. This guide assumes the validator key files are stored on the Ubuntu server here:
$HOME/eth2.0-deposit-cli/validator_keys.
The steps to sign-up are:
- Get Göerli ETH
- Generate the validator keys. Each key is a validator account
- Fund the validator account(s) with 32 Göerli ETH per account
- Wait for your validator account(s) to become active
Let’s get started.
Get Goerli ETH
- Go to a computer with the MetaMask browser extension installed.
- Click on MetaMask and log in.
- Using the drop-down at the top, select the Göerli Test Network.
- Click on the account name to copy your Göerli Test Network wallet address.
- Using your address, get Göerli ETH from the authenticated faucet or via the
#request-goerli-ethchannel on the ethstaker Discord using the bot command:!goerliEth <yourwalletaddress>.
NOTE: Each validator requires a 32 ETH deposit. You should have sufficient Göerli ETH in your MetaMask wallet to fund each validator. For example, if you want 10 validators you need to have 320 Göerli ETH plus some extra (e.g. 1 Göerli ETH) to pay for the gas fees.
Generate Validator Keys
Next we will generate the validator keys. The validator client supports multiple validator keys. Each validator key is basically a “validator account” on the Medalla testnet.
Clone the deposit generator client.
$ cd ~
$ git clone https://github.com/ethereum/eth2.0-deposit-cli.git
$ cd eth2.0-deposit-cli
Check the Python version (Python 3.7 and above is required).
$ python3 -VIf you don’t have Python (or have a version below 3.7), follow these steps.
$ sudo apt install software-properties-common
$ sudo add-apt-repository ppa:deadsnakes/ppa
$ sudo apt update
$ sudo apt install python3.7
Install the prerequisites.
$ sudo apt install python3-pipInstall the application to generate the validator keys.
Change <numberofvalidators> to the number of validator keys you want to create. E.g. --num_validators 5.
$ sudo ./deposit.sh install
$ ./deposit.sh new-mnemonic --num_validators <numberofvalidators> --mnemonic_language=english --chain medalla
After running this step you should have a deposit JSON file, some validator key JSON files, a password, and a mnemonic seed phrase. You should back up all of these somewhere safe.
Success!
Your keys can be found at: /home/<yourusername>/eth2.0-deposit-cli/validator_keys
Copy Deposit Data File
In the validator_keys directory there will be a deposit_data-[timestamp].json file. You will need to upload this via a website in the next step. Since we are on a server we don’t have a web browser so secure FTP (SFTP) the file to a desktop computer that does.
Fund the Validator Keys
This step involves depositing the required amount of Göerli ETH to the Medalla testnet staking contract. This is done on the Eth2.0 Lauchpad website.
WARNING: DO NOT send real ETH to the Medalla testnet. You will lose your ETH.
Go here: https://medalla.launchpad.ethereum.org/
Click through the warning steps then select the number of validators you are going to run. Scroll down and click continue.

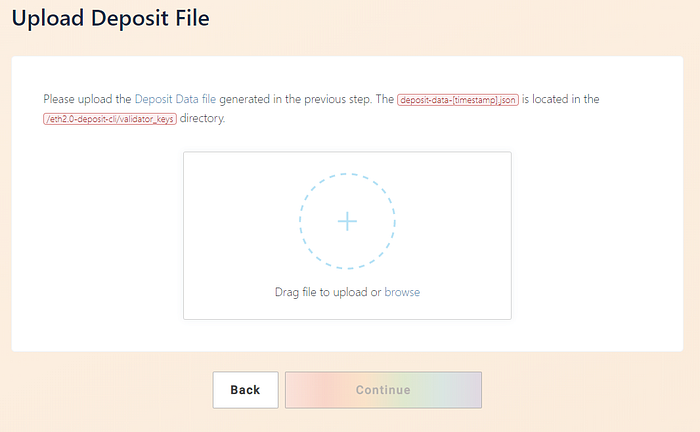
You will be asked to upload the deposit_data-[timestamp].json file. Browse or drag the file and click continue.
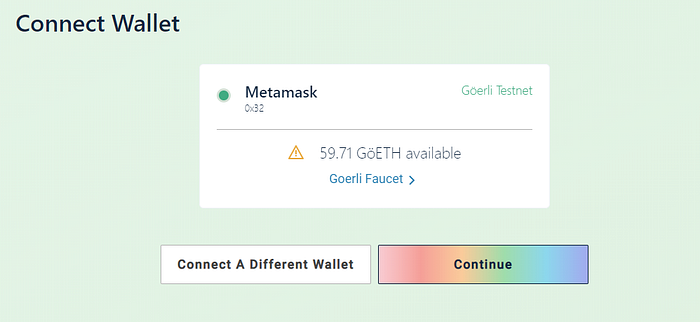
Connect your wallet. Choose MetaMask, log in, select the Göerli Test Network and click Continue.
WARNING: Be absolutely 100% sure you have selected the Göerli Test Network in MetaMask. DO NOT sent real ETH to the Medalla testnet.

Your MetaMask balance will be displayed. The site will allow you to continue if you have sufficient Göerli ETH balance.
A summary shows the number of validators and total amount of Göerli ETH required. Tick the boxes if you agree and click continue.

Click on initiate all transactions. This will pop open multiple instances of MetaMask, each with a 32 Göerli ETH transaction request to the Medalla testnet deposit contract. Confirm each transaction.
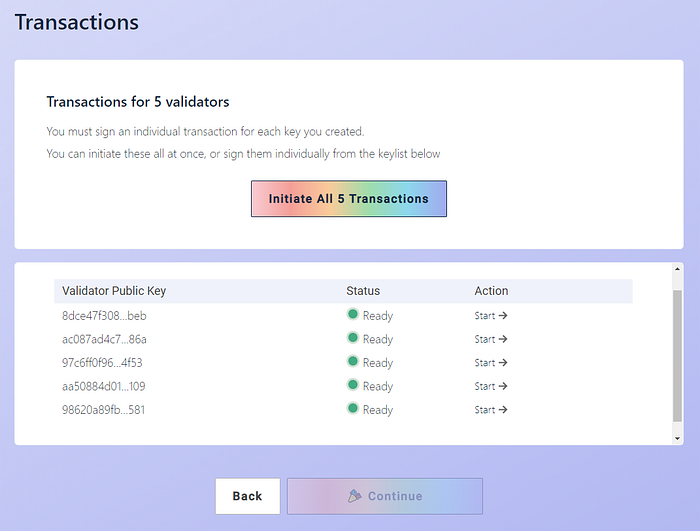
Once all the transactions have successfully completed you are done!
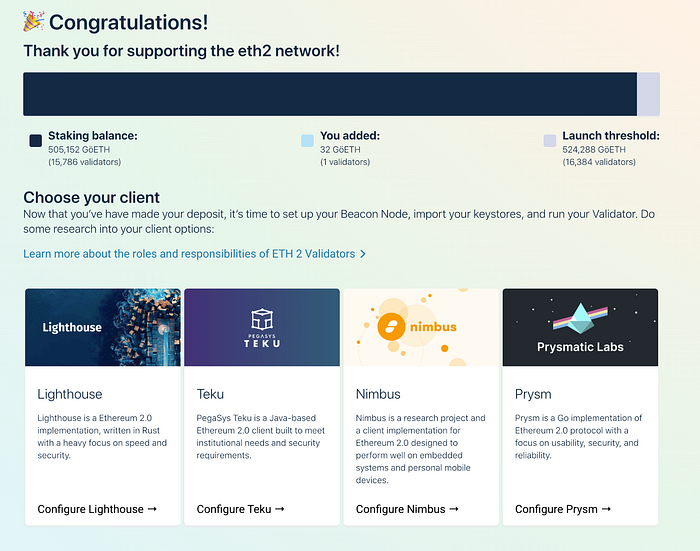
Check the Status of Your Validators
Newly added validators can take a while (hours to days) to activate. You can check the status of your keys with these steps:
- Copy your Göerli Test Network wallet address
- Go here: https://medalla.beaconcha.in/
- Search your wallet address. Your keys will be shown.
Click on a key to see the Estimated Activation information.

That’s it! Now let’s create the validator wallet.
Step 9— Create the Validator Wallet
First create a directory to store the validator wallet and give the current user permissions to access it. Change <yourusername> to your logged in username.
$ sudo mkdir -p /var/lib/prysm/validator
$ sudo chown -R <yourusername>:<yourusername> /var/lib/prysm/validator
Next we will use the Prysm validator binary we complied earlier to create a key wallet using the keys we generated in the previous step.
$ cd prysm
$  bazel run //validator:validator -- accounts import --keys-dir=$HOME/eth2.0-deposit-cli/validator_keys --accept-terms-of-use --medalla
You will be asked to provide a wallet directory. This is where your new wallet will be created. Use /var/lib/prysm/validator.
Enter a wallet directory (default: /home/ethstaker/.eth2validators/prysm-wallet-v2):
/var/lib/prysm/validator
You will be asked to provide a new wallet password. It must have more than 8 characters, at least 1 special character, and 1 number. Make sure you keep it safe!
Next you will need to enter the password you used to create the validator keys on the Eth2 Launch Pad site. If you enter it correctly the accounts will be imported into the new wallet.
[2020-10-21 07:02:15]  WARN flags: Running on Medalla Testnet
Enter a wallet directory (default: /home/ethstaker/.eth2validators/prysm-wallet-v2):
/var/lib/prysm/validator
New wallet password:
Confirm password:
[2020-10-21 07:02:37]  INFO accounts: Successfully created new wallet wallet-path=/var/lib/prysm/validator
Enter the password for your imported accounts:
Importing accounts, this may take a while...
Importing accounts... 100% [=========================================]  [36s:0s]
Successfully imported 40 accounts, view all of them by running accounts list
Confirm the validator accounts have been created.
$ bazel run //validator:validator -- accounts list --medalla --wallet-dir /var/lib/prysm/validator --accept-terms-of-useCreate a file to store the wallet password so the validator can access the wallet without having to manually supply the password. The file will be named password.txt.
$ touch /var/lib/prysm/validator/password.txt
$ sudo nano /var/lib/prysm/validator/password.txt
Add your new wallet password to the file. Save and exit.
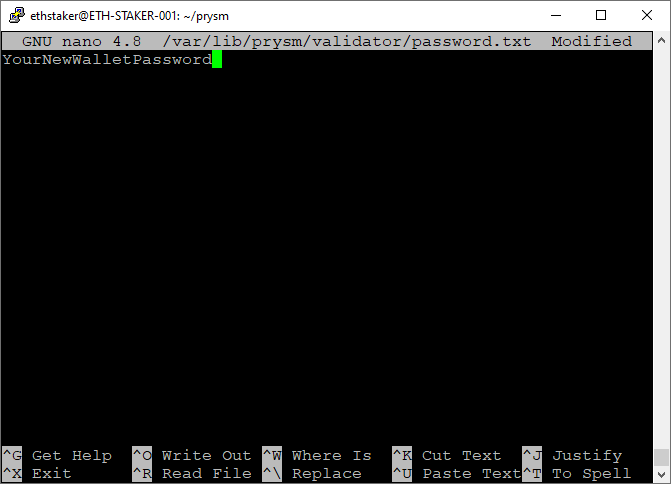
Protect the document by removing access for g(roup)o(ther).
$ sudo chmod go-rw /var/lib/prysm/validator/password.txtThat’s it! Now that the validator wallet and password file are configured we will set up the validator itself to run as a service.
***
NOTE: This guide is now deprecated. Please use the newer version targeting the Pyrmont testnet.
*** located here.
Step 10— Configure the Validator
Setup Accounts and Directories
We will run the validator as a service so if the system restarts the process will automatically start back up again.
Create an account for the service to run under. This type of account can’t log into the server.
$ sudo useradd --no-create-home --shell /bin/false prysm-validatorWe created the data directory for the validator in the previous step: /var/lib/prysm/validator. Now set directory permissions so the prysm-validator account can modify the validator account data directory.
$ sudo chown -R prysm-validator:prysm-validator /var/lib/prysm/validatorNext, copy the validator binary that we compiled earlier to the /usr/local/bin directory.
$ cd ~
$ sudo cp prysm/bazel-bin/validator/validator_/validator /usr/local/bin
Create and Configure the Service
Create a systemd service file to store the service config.
$ sudo nano /etc/systemd/system/prysm-validator.servicePaste the following into the file exactly as it appears below with the following exceptions:
Replace <POAPstring> with your Prysm POAP participation medal value for a special NFT prize! E.g. --graffiti "abcdefg12345"
[Unit]
Description=Validator
Wants=network-online.target
After=network-online.target[Service]
Type=simple
User=prysm-validator
Group=prysm-validator
Restart=always
RestartSec=5
ExecStart=/usr/local/bin/validator --medalla --datadir /var/lib/prysm/validator --wallet-dir /var/lib/prysm/validator --wallet-password-file /var/lib/prysm/validator/password.txt --graffiti "<POAPString>" --accept-terms-of-use[Install]
WantedBy=multi-user.target
The --medalla flag is required to indicate we are running against the testnet.
The --accept-terms-of-use flag is required in order to be able to run the binary as a service. Using this flag indicates acceptance of the Prysm terms of use.
Check the screen shot below for reference. Exit and save.
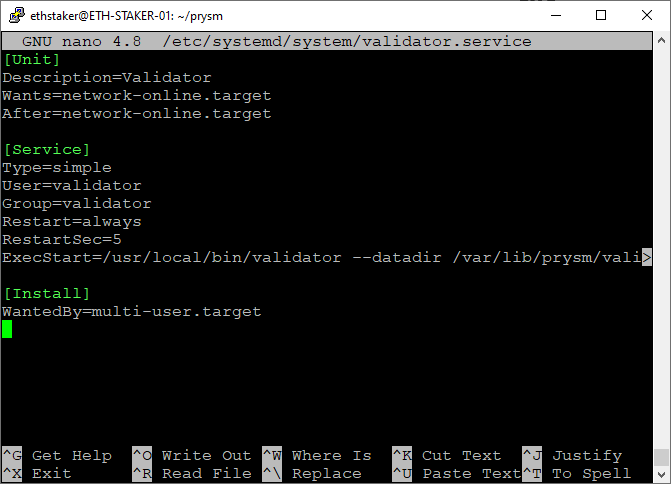
Reload systemd to reflect the changes.
$ sudo systemctl daemon-reloadStart the service and check to make sure it’s running correctly.
$ sudo systemctl start prysm-validator
$ sudo systemctl status prysm-validator
You should see output that looks something like this.
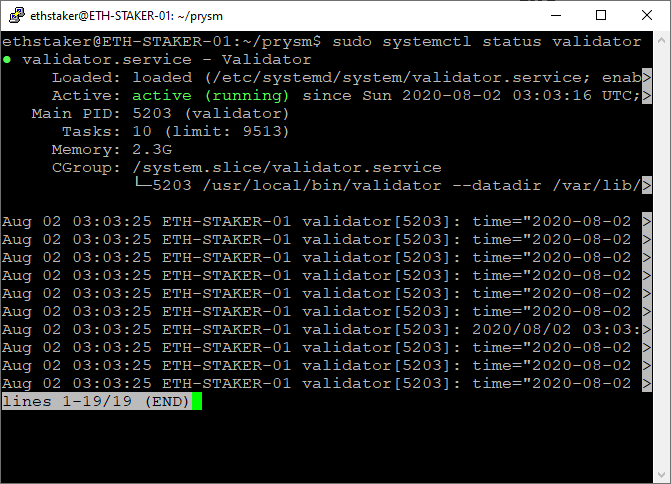
If you did everything right, it should say active (running) in green text. If not then go back and repeat the steps to fix the problem. Press Q to quit.
Enable the validator service to automatically start on reboot.
$ sudo systemctl enable prysm-validatorYou can check the progress by running the journal command. Press Ctrl+C to quit.
$ sudo journalctl -f -u prysm-validator.serviceIt can take hours to activate the validation accounts(s) once the beacon chain has actually started processing . The output from the validator process indicates the status.
Oct 21 07:12:24 ETH-STAKER-001 validator[86456]: time="2020-10-21 07:12:24" level=info msg="Waiting for beacon node to sync to latest chain head" prefix=validatorYou can check the status of your validator(s) via beaconcha.in. Simply do a search for your validator public key(s) or search using your MetaMask wallet address. It may be a while before they appear on the site.
That’s it. We have a functioning beacon chain and validator. Congratulations: you are awesome!
***
NOTE: This guide is now deprecated. Please use the newer version targeting the Pyrmont testnet.
*** located here.
Step 11 — Install Prometheus
Prometheus is an open-source systems monitoring and alerting toolkit. It runs as a service on your Ubuntu server and its job is to capture metrics. More information here.
We are going to use Prometheus to expose runtime data from the beacon-chain and validator as well as instance specific metrics.
Create User Accounts
Accounts for the services to run under. These accounts can’t log into the server.
$ sudo useradd --no-create-home --shell /bin/false prometheus
$ sudo useradd --no-create-home --shell /bin/false node_exporter
Create Directories
Program and data directories.
$ sudo mkdir /etc/prometheus
$ sudo mkdir /var/lib/prometheus
Set directory ownership. The prometheus account will manage these.
$ sudo chown -R prometheus:prometheus /etc/prometheus
$ sudo chown -R prometheus:prometheus /var/lib/prometheus
Download Prometheus software
Adjust the version number to the latest version from the Prometheus download page. Rpi users be sure to get the ARM binary.
$ cd ~
$ curl -LO https://github.com/prometheus/prometheus/releases/download/v2.22.0/prometheus-2.22.0.linux-amd64.tar.gz
Unpack the archive. It contains two binaries and some content files.
$ tar xvf prometheus-2.22.0.linux-amd64.tar.gzCopy the binaries to the following locations.
$ sudo cp prometheus-2.22.0.linux-amd64/prometheus /usr/local/bin/
$ sudo cp prometheus-2.22.0.linux-amd64/promtool /usr/local/bin/
Set directory ownership. The prometheus account will manage these.
$ sudo chown -R prometheus:prometheus /usr/local/bin/prometheus
$ sudo chown -R prometheus:prometheus /usr/local/bin/promtool
Copy the content files to the following locations.
$ sudo cp -r prometheus-2.22.0.linux-amd64/consoles /etc/prometheus
$ sudo cp -r prometheus-2.22.0.linux-amd64/console_libraries /etc/prometheus
Set directory and file (-R) ownership. The prometheus account will manage these.
$ sudo chown -R prometheus:prometheus /etc/prometheus/consoles
$ sudo chown -R prometheus:prometheus /etc/prometheus/console_libraries
Remove the downloaded archive.
$ rm -rf prometheus-2.22.0.linux-amd64.tar.gz prometheus-2.22.0.linux-amd64Edit the Configuration File
Prometheus uses a configuration file so it knows where to scrape the data from. We will set this up here.
Open the YAML config file for editing.
$ sudo nano /etc/prometheus/prometheus.ymlPaste the following into the file taking care not to make any additional edits and exit and save the file.
global:
  scrape_interval:     15s # Set the scrape interval to every 15 seconds. Default is every 1 minute.
  evaluation_interval: 15s # Evaluate rules every 15 seconds. The default is every 1 minute.
  # scrape_timeout is set to the global default (10s).
# Alertmanager configuration
alerting:
  alertmanagers:
  - static_configs:
    - targets:
      # - alertmanager:9093
# Load rules once and periodically evaluate them according to the global 'evaluation_interval'.
rule_files:
  # - "first_rules.yml"
  # - "second_rules.yml"
# A scrape configuration containing exactly one endpoint to scrape:
# Here it's Prometheus itself.
scrape_configs:
  - job_name: 'validator'
    static_configs:
      - targets: ['localhost:8081']
  - job_name: 'beacon node'
    static_configs:
      - targets: ['localhost:8080']
  - job_name: 'node_exporter'
    static_configs:
      - targets: ['localhost:9100']
The scrape_configs define the output target for the different job names. We have 3 job names: validator, beacon node, and node_exporter. The first two are obvious, the last one is for metrics related to the server instance itself (memory, CPU, disk, network etc.). We will install and configure node_exporter below.
Set ownership for the config file. The prometheus account will own this.
$ sudo chown -R prometheus:prometheus /etc/prometheus/prometheus.ymlFinally, let’s test the service is running correctly.
$ sudo -u prometheus /usr/local/bin/prometheus \
    --config.file /etc/prometheus/prometheus.yml \
    --storage.tsdb.path /var/lib/prometheus/ \
    --web.console.templates=/etc/prometheus/consoles \
    --web.console.libraries=/etc/prometheus/console_libraries
Output should look something like this. Press Ctrl + C to exit.
level=info ts=2020-10-21T07:18:00.434Z caller=main.go:684 msg="Server is ready to receive web requests."Set Prometheus to Auto-Start as a Service
Create a systemd service file to store the service config which tells systemd to run Prometheus as the prometheus user, with the configuration file located in the /etc/prometheus/prometheus.yml directory, and to store its data in the /var/lib/prometheus directory.
$ sudo nano /etc/systemd/system/prometheus.servicePaste the following into the file. Exit and save.
[Unit]
Description=Prometheus
Wants=network-online.target
After=network-online.target[Service]
Type=simple
User=prometheus
Group=prometheus
Restart=always
RestartSec=5
ExecStart=/usr/local/bin/prometheus \
    --config.file /etc/prometheus/prometheus.yml \
    --storage.tsdb.path /var/lib/prometheus/ \
    --web.console.templates=/etc/prometheus/consoles \
    --web.console.libraries=/etc/prometheus/console_libraries[Install]
WantedBy=multi-user.target
Reload systemd to reflect the changes.
$ sudo systemctl daemon-reloadAnd then start the service with the following command and check the status to make sure it’s running correctly.
$ sudo systemctl start prometheus
$ sudo systemctl status prometheus
Output should look something like this.

If you did everything right, it should say active (running) in green. If not then go back and repeat the steps to fix the problem. Press Q to quit.
Lastly, enable Prometheus to start on boot.
$ sudo systemctl enable prometheusStep 12 — Install Node Exporter
Prometheus will provide metrics about the beacon chain and validators. If we want metrics about our Ubuntu instance, we’ll need an extension called Node_Exporter. You can find the latest stable version here if you want to specify a different version below. Rpi users remember to get the ARM binary.
$ cd ~
$ curl -LO https://github.com/prometheus/node_exporter/releases/download/v1.0.1/node_exporter-1.0.1.linux-amd64.tar.gz
Unpack the downloaded software.
$ tar xvf node_exporter-1.0.1.linux-amd64.tar.gzCopy the binary to the /usr/local/bin directory and set the user and group ownership to the node_exporter user we created above.
$ sudo cp node_exporter-1.0.1.linux-amd64/node_exporter /usr/local/bin
$ sudo chown -R node_exporter:node_exporter /usr/local/bin/node_exporter
Remove the downloaded archive.
$ rm -rf node_exporter-1.0.1.linux-amd64.tar.gz node_exporter-1.0.1.linux-amd64Set Node Exporter to Auto-Start as a Service
Create a systemd service file to store the service config which tells systemd to run Node_Exporter as the node_exporter user.
$ sudo nano /etc/systemd/system/node_exporter.servicePaste the following into the file. Exit and save.
[Unit]
Description=Node Exporter
Wants=network-online.target
After=network-online.target[Service]
User=node_exporter
Group=node_exporter
Type=simple
ExecStart=/usr/local/bin/node_exporter[Install]
WantedBy=multi-user.target
Reload systemd to reflect the changes.
$ sudo systemctl daemon-reloadAnd then start the service with the following command and check the status to make sure it’s running correctly.
$ sudo systemctl start node_exporter
$ sudo systemctl status node_exporter
Output should look something like this.

If you did everything right, it should say active (running) in green. If not then go back and repeat the steps to fix the problem. Press Q to quit.
Finally, enable Node Exporter to start on boot.
$ sudo systemctl enable node_exporterTest Prometheus and Node Exporter
Everything should be ready to go. You may optionally test the functionality by opening a port in the firewall (see Step 2) and browsing to http://<yourserverip>:9090. From there you can run queries to view different metrics. For example try this query to see how much memory is free in bytes:
http://<yourserverip>:9090/new/graph?g0.expr=node_memory_MemFree_bytes&g0.tab=1&g0.stacked=0&g0.range_input=1hOr try this query to see the balance for all of your validators.
http://<yourserverip>:9090/graph?g0.range_input=1h&g0.expr=validator_balance&g0.tab=1Step 13 — Install Grafana
While Prometheus is our data source, Grafana is going provide our reporting dashboard capability. Let’s install it and configure a dashboard.
We will install using an APT repository because it is easier to install and update. Grafana is available in the official Ubuntu packages repository, however the version of Grafana there may not be the latest, so we will use Grafana’s official repository.
Download the Grafana GPG key with wget, then pipe the output to apt-key. This will add the key to your APT installation’s list of trusted keys.
$ wget -q -O - https://packages.grafana.com/gpg.key | sudo apt-key add -Add the Grafana repository to the APT sources.
$ sudo add-apt-repository "deb https://packages.grafana.com/oss/deb stable main"Refresh the apt cache.
$ sudo apt updateMake sure Grafana is installed from the repository.
$ apt-cache policy grafanaOutput should look like this.
grafana:
  Installed: (none)
  Candidate: 7.2.1
  Version table:
     7.2.1 500
        500 https://packages.grafana.com/oss/deb stable/main amd64 Packages
     7.2.0 500
        500 https://packages.grafana.com/oss/deb stable/main amd64 Packages
     7.1.5 500
        500 https://packages.grafana.com/oss/deb stable/main amd64
     ...
Verify the version at the top matches the latest version shown here. Then proceed with the installation.
$ sudo apt install grafanaStart the Grafana server and check the status to make sure it’s running correctly.
$ sudo systemctl start grafana-server
$ sudo systemctl status grafana-server
Output should look something like this.

If you did everything right, it should say active (running) in green. If not then go back and repeat the steps to fix the problem. Press Q to quit.
Enable Grafana to start on boot.
$ sudo systemctl enable grafana-serverConfigure Grafana Login
Great job on getting this far! Now that you have everything up and running you can go to http://<yourserverip>:3000/ in a browser and the Grafana login screen should come up.
NOTE: This is not a secure connection. Fine for testnet purposes, but for mainnet a secure HTTPS connection is required.
Enter admin for the username and password. It will prompt you to change your password and you should definitely do that.
Configure the Grafana Data Source
Let’s configure a datasource. Move your mouse over the gear icon on the left menu bar. A menu will pop-up — choose Data Sources.
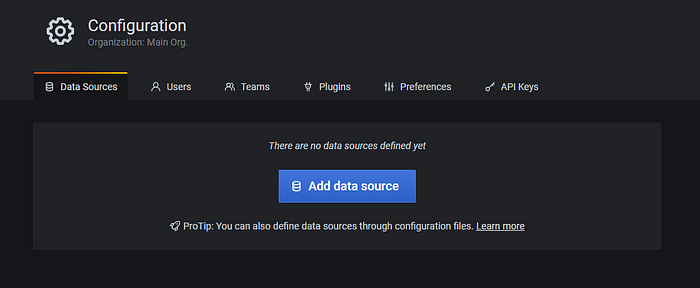
Click on Add Data Source and then choose Prometheus. Enter http://localhost:9090 for the URL then click on Save and Test.


Import a Grafana Dashboard
Now let’s import a dashboard. Move your mouse over the + icon on the left menu bar. A menu will pop-up - choose Import.
Paste the JSON from here (or here if you have more than 10 validators) and click Load then Import. You should be able to view the dashboard. At first you may not have sufficient data, but after the testnet starts and validators are activated for a while you will see some metrics and alerts.

Alerts are also available through Telegram and Discord. See here for instructions.
***
NOTE: This guide is now deprecated. Please use the newer version targeting the Pyrmont testnet.
*** located here.
Final Remarks
Okay… That’s it! We are done! I hope you enjoyed this guide.
- A future update includes a more comprehensive dashboard (additional hardware metrics and metrics on the eth1 node).
- If you have feedback you can reach me on Twitter or Reddit.
- If you liked this guide and think others would benefit from it then please share it using the friends link!
- Tips appreciated: somer.eth
